SPLAT! is a cross-platform, open-source software that can be used to analyze a radio link between two locations and to generate coverage maps of RF transmitters. Coverage maps are calculated using Longley-Rice Irregular Terrain Model (ITM) algorithm. SPLAT! can predict RF coverage for any frequencies between 20 MHz and 20 GHz. It is thus useful for ham radio, broadcast radio, terrestrial television and wireless networks.
To use SPLAT!, you need to know some parameters of the transmitter. These are the exact location (coordinates), antenna height, transmission frequency, polarization and effective radiated power (ERP). SPLAT! can then compute coverage maps. The procedure of installing SPLAT! is described in a previous article. You can generate two kind of maps. There is the regional coverage analysis mode that will output line-of-sight coverage map assuming all waves propagate in a straight line. There is also the path loss analysis mode that uses the ITM algorithm to compute either a field strength map or a received signal strength map.

Input files
Let's mention that SPLAT! takes coordinates as degrees latitude West and degrees longitude North. So if we're talking about European locations, latitude must be negative. I'll use for demonstration purposes a Romanian television transmitter with the following parameters:
- Location: 45° 25" 37.49 North / 25° 29" 06.0 East
- Antenna height: 94 meters (at 2490 meters altitude)
- Frequency: 474 MHz and horizontal polarization
- ERP: 150 kW
For this transmitter I must make two files with the same name:
tx1.qth
Site-1 ; write whatever name you want here
45 25 37.49
-25 29 06.0
94m
tx1.lrp
15.000 ; Earth Dielectric Constant (Relative permittivity)
0.005 ; Earth Conductivity (Siemens per meter)
301.000 ; Atmospheric Bending Constant (N-units)
474.000 ; Frequency in MHz (20 MHz to 20 GHz)
5 ; Radio Climate (5 = Continental Temperate)
0 ; Polarization (0 = Horizontal, 1 = Vertical)
0.50 ; Fraction of situations (50% of locations)
0.90 ; Fraction of time (90% of the time)
150000.0 ; Effective Radiated Power (ERP) in Watts (optional)
In the LRP file remember to adjust climate and terrain parameters if the case. The default will work for most situations. Adjust frequency, polarization and ERP. The statistical parameters play an important role (situations and time). For digital television (although these are for ATSC standard) values 0.5 and 0.9 are recommended for situations, respectively time.
Now, to generate a line-of-sight map, run SPLAT with the following parameters:
splat -t tx1.qth -c 10 -metric -o test.ppm -d /path/to/sdf-sd
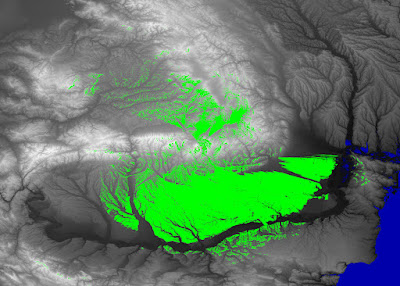
Argument -c 10 specifies antenna height in meters. The result is the following:

Generating path loss map is not very different. The command is:
splat -t tx1.qth -L 10 -dbm -metric -o test.ppm -d /path/to/sdf-sd
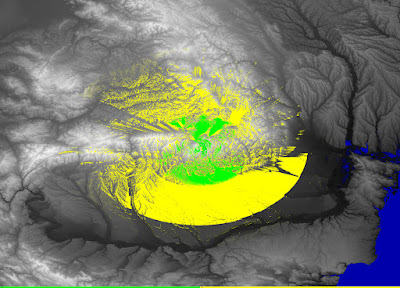
In this situation, argument -L 10 specifies antenna height in meters. The result is the top image in this post. To adjust colors, you need to make a different configuration file, with the same name as the QTH file and with the extension SCF for signal levels expressed as dBuV/m or DCF for signal expressed as dBm. You switch to dBm mode by using the -dbm argument (see my example). The SCF/DCF file syntax is very simple and consists of signal thresholds followed by color (RGB values).
-50: 0, 255, 0
-80: 255, 255, 0
This example of tx1.dcf will paint all areas with signal above -50 dBm in green color and all areas with signal between -50 dBm and -80 dBm as yellow.
Suggested reading


No comments :
Post a Comment
Please read the comments policy before publishing your comment.